Facebook currently service’s 1.39 billion users with a mobile base of more than 1.19 billion subscribers. The social network has shown no real signs of slowing on a global level, and with that growth advertisers have hurried to discover all of the companies stats and trends.
According to the team at Invesp, businesses and organizations need to focus on mobile advertising because that is where the bulk of Facebook’s active social media users now reside. The infographic shows that mobile news feed ads and custom audiences are creating strong conversions and click-through rates. The study also finds that Facebook users are now spending an average of 40 minutes per day on the web platform.
Facebook has also grown from $1.974 billion in 2010 to $12.4666 billion in 2014. US and Canada claim the biggest part of the advertising space for Facebook with revenue at 45.98%. Europe takes 27.24%, Asia 15.14% and 11.61% shared across the rest of the world. 9% of the digital ad spending and 18% of the global mobile digital ad spending.
As a whole Facebook accounts for 9% of worldwide digital ad spend and 18% of the global mobile digital ad buy.
According to Invesp, Facebook has attracted more than 30 million business fan pages while 19 million businesses have optimized their pages for mobile viewing, and 1.5 million have spent money on mobile advertising. In a recent survey, 92% of social marketers considered Facebook to be a critical tool when it comes to social media marketing.
Because of the popularity surrounding Facebook ads, the cost per spot is now 122% higher than it was just one year earlier.
The study also found that a majority of Facebook ads are targeted at users between 13 and 65-years-old. They also found that 85% of FB ads are targeted at specific countries and 45% are targeted at specific interests.
The “Shop Now” button leads Facebook CTA in popularity at 74% followed by “Learn More” and “Book Now” at 10% and 8% respectively. Other action items include “Download” and “Signup” buttons at 4% each.
In Q4 2014 Facebook also reported earnings per user at $8.26 in the US and Canada, $3.22 in Europe and $1.21 per user in Asia.
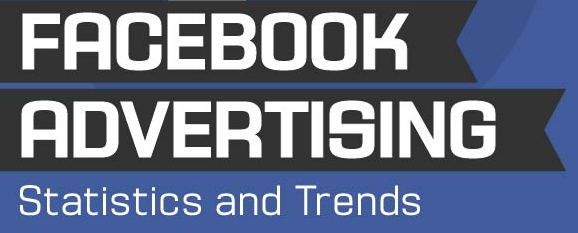
Here is the full Facebook Trends and Statistics Infographic:
