
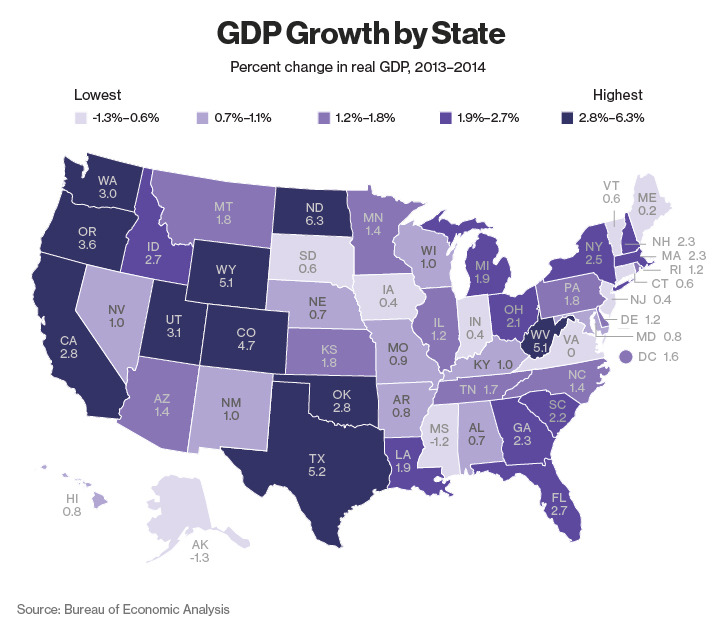
A new report released by the Bureau of Economic Analysis on Wednesday shows how each state grew its GDP in 2014. The map demonstrates how U.S. growth keeps shifting further West, specifically in the Southwest where a growth rate of 4.3 percent was experienced. In Texas, residents helped the state’s GDP grow by 5.2 percent, the fastest of any state by dollar growth.
The Rocky Mountain region saw a 3.9 percent expansion as the Far West, which includes California, Oregon, Washington and Nevada, grew 2.7 percent.
The west was helped along by a surge in mining, professional, scientific and technical services.
North Dakota was the fastest-expanding state with a GDP increase of 6.3 percent, following a 0.9 percent advance in 2013 that was revised down sharply from a previously reported 9.7 percent rate.
The Plains slowed overall to a 1.3 percent advance, down from 1.8 percent the prior year. No region East of the Mississippi experienced growth. In Mississippi, the economy contracted 1.2 percent after dropping 1.1 percent in 2013.
Alaska also contracted 1.3 percent following a 4 percent contraction the prior year.
All 50 states combined for a 2.2 percent expansion in 2014, up from 1.9 percent growth the prior year.