
The human mind isn’t meant to deal in numbers past a certain point. Rather, more concrete comparisons are what really drive our understanding and decision making. Along these lines, a poignant new data visualization presented by Expensivity shares some unique insights into how credit cards are used across America.
Of note, is that there are large regional differences between how credit cards are utilized in America. These differences include the percentage of income locations are willing to utilize on credit card debt, the types of credit cards individuals are interested in, and even a range of locations where a majority of adults don’t have credit cards.
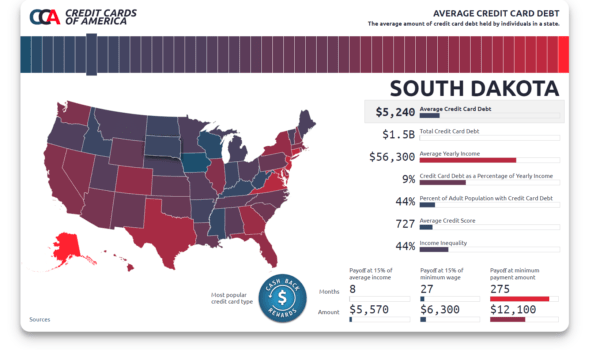
Here at BusinessPundit, we found this graphic insightful as it allows for comparisons across a range of metrics. Income inequality, average earnings of individual within a state, and average credit score are particularly noteworthy when compared to credit card debt.
Below we’ll look through three trends pulled out in Expensivity’s interactive graphic.
Average credit scores track with income inequality
Perhaps this comes as no surprise. It’s well documented that few external pressures can make an individual make worse choices than the chronic stressors of poverty. The worst credit scores in the nation tend to be throughout the Southeast. Which also tends to be where the highest levels of income inequality are.
Of course, income equality can mean many different things. In a location with relatively higher average earnings, high income inequality doesn’t have to mean a larger number of impoverished individuals. For example, Texas, Florida, and New York all have some of the highest income inequalities in the nation, but all three have substantially higher average earnings than the bulk of the Southeast.
On the flip side, some of the lowest levels of income inequality persist throughout the Great Plains. These locations also some of the highest average credit scores.
All in all, one takeaway could be that when possible individuals do try to manage their credit card debt appropriately. And that bulk lower credit scores tend to track with families who have less choice about planning their financial future, or are enduring some sort of hardship.
Average Credit Card Debt Nearly Doubles Between States
Perhaps this is a no brainer due to the range of costs of living and average incomes across portions of the United States. But this stat potentially points to some regional attitudes about the holding of debt.
The average credit card debt per individual in 40+ American states ranges between $4,700 and $6,000. In the remaining 10 states, average credit card debt jumps to $8,000.
Coastal locations with booming economies and high cost of living tend to populate the list of locations taking on the most debt per individual. This includes New York, New Jersey, Connecticut, Maryland, Virginia, California, and Washington. With one outlier, by far the highest level of credit card debt per individual occurs in Alaska.
One takeaway here is that locations with higher cost of living tend to lead to higher credit card borrowing. This isn’t exactly surprising, as many of the highest cost-of-living locations have other returns, cultural, access to nature (Alaska has the highest cost of living in America), or economically.
Another note is that there may be a cultural component here. Many locations currently hosting oil booms throughout the midwest and great plains tend to have much higher average earnings than the rest of the US. Due to the rush for homes in the region, living expenses also aren’t low like they once were. But this region shows perhaps the lowest average credit card debt in the nation. Undoubtedly there are cultural differences between Nebraska and Connecticut, or Oklahoma and D.C. And there’s no way to truly test this point. But it’s interesting to see such disparate credit card outcomes between locations.
Time To Payoff Tracks Across Locations
One observation that seems to hint at individuals from all locations watching their credit to some degree, is that the time to pay off credit cards with the average income level just varies by a few months between all states.
To be specific, we’re talking about an individual aggressively paying off debt. In this case they make an average wage for their state and spend 15% of it per month on paying off credit card debt.
By this metric, the states where the debt would be paid off quickest would require 7 months to pay off credit card debt. While those who would be slowest would require 11. While the number for individuals making less than average wage varies significantly more, this does signal that individuals with average earnings are using credit somewhat responsibly more often than not.